
Converter Design Optimisation
This work proposed an integrated framework for comparing power converter designs by loss, mass and cost, using consistent component data and electrical and thermal models. The author defined its overall architecture, led its early and intermediate research and planning, and later continued the approach independently through AIPE.
Why Converter Design Is a Trade-Off
Converter design involves coupled choices. Raising the switching frequency shrinks the magnetic components but increases switching loss; that extra heat in turn demands a larger heat sink, which adds mass and cost. Each component is usually designed with its own tools and assumptions, so these interactions are hard to see. Comparing candidate designs fairly requires evaluating all components with consistent data under the same operating conditions.
There is rarely a single best design. Improving one objective, such as efficiency, usually costs another, such as power density. Optimal design therefore looks for the set of designs in which no objective can improve without another getting worse, the Pareto front, and then chooses a point on it from the project’s priorities.
The Optimal Design Process
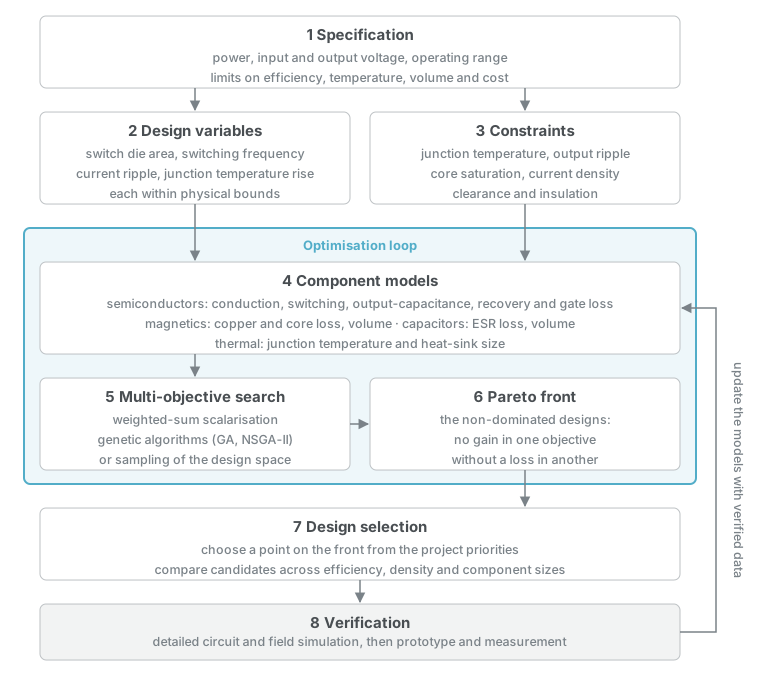
- Specification. Fix the ratings, voltages and operating range, and the limits on efficiency, temperature, volume and cost.
- Design variables. Choose the quantities the optimiser may change, such as switch die area, switching frequency, current ripple and junction temperature rise, each within physical bounds.
- Constraints. State what every design must satisfy: junction temperature, output ripple, core saturation, current density, clearance and insulation.
- Component models. Express each component’s loss and size as functions of the design variables, using consistent data for semiconductors, magnetics, capacitors and cooling.
- Multi-objective search. Explore the design space by weighted-sum scalarisation, by genetic algorithms such as NSGA-II, or by sampling.
- Pareto front. Keep only the non-dominated designs.
- Design selection. Choose a point on the front, comparing candidates across efficiency, power density and component sizes.
- Verification. Check the chosen design with detailed simulation and a prototype, and feed the verified data back into the models.
The Proposed Design Framework
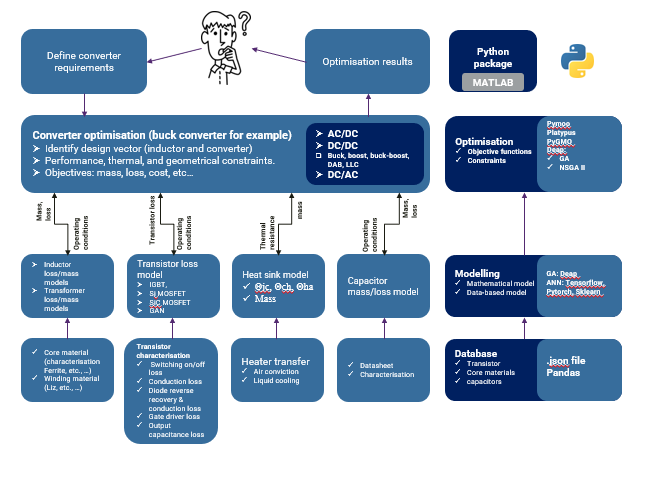
The framework brings together semiconductors, magnetics, capacitors and cooling. Manufacturer data and characterisation results support reusable component models, so candidate designs can be evaluated under the same operating conditions. The diagram uses a buck converter to illustrate the workflow and outlines wider converter applications.
Example: A 1 kW Buck-Type Inverter
The optimisation code applies the process to a single-phase buck-type voltage-source inverter: 430 V to 230 V at a nominal 1 kW and 4.35 A. It reconstructs in Python a MATLAB design workflow from a collaboration with Cardiff University, with explicit physics-based loss and volume models.
| Design variable | Range |
|---|---|
| Switch die area | 0.35 to 4.5 times a 45.6 mm² reference die |
| Switching frequency | 50 to 300 kHz |
| Inductor current ripple | 10% to 50% of the output current |
| Junction temperature rise | up to 75 K above a 25 °C ambient |
For each design, the models sum the semiconductor loss (conduction, switching, output capacitance, reverse recovery and gate drive), the inductor loss and the capacitor loss, and the volumes of the switches, inductor and capacitor. The heat sink is not included in the volume. The objectives are efficiency and power density.
Pareto Front
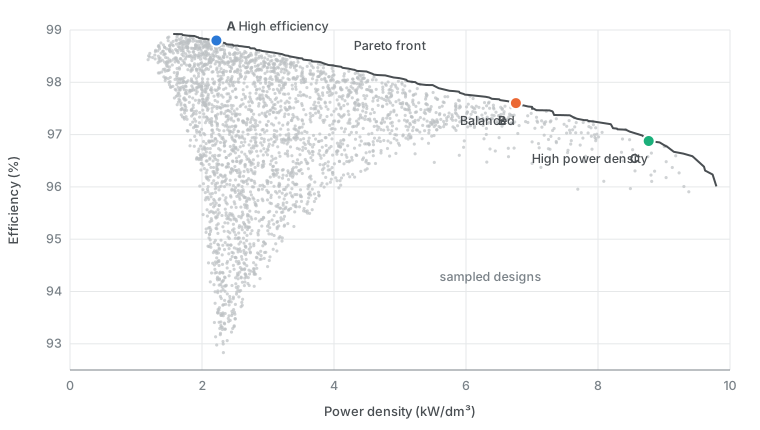
Sampling 60,000 designs across these ranges with the code’s models shows the trade-off clearly. Along the front, efficiency falls from about 98.9% at 1.6 kW/dm³ to 96.2% at 9.7 kW/dm³. Moving along it, the switching frequency rises from 50 to 300 kHz and the die area shrinks: the passive components get smaller, while switching and conduction losses grow.
Comparing Designs on the Front
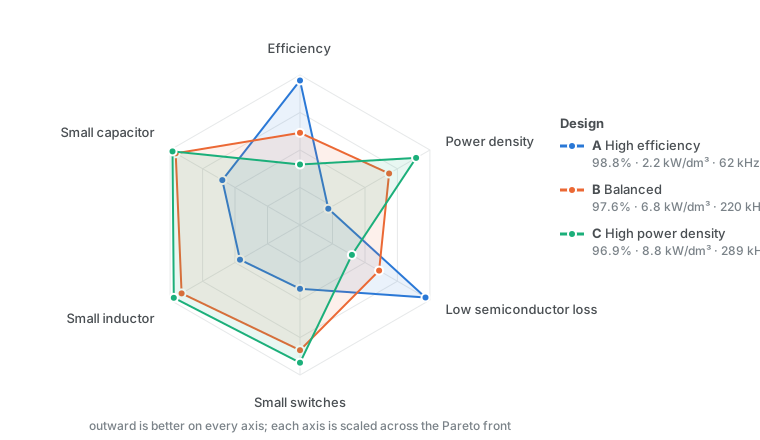
Three designs on the front show what the choice involves. Each axis of the radar chart is scaled across the front, with outward always better, so a design’s shape shows where it gains and what it gives up.
| A: High efficiency | B: Balanced | C: High power density | |
|---|---|---|---|
| Efficiency | 98.8% | 97.6% | 96.9% |
| Power density | 2.2 kW/dm³ | 6.8 kW/dm³ | 8.8 kW/dm³ |
| Switching frequency | 62 kHz | 220 kHz | 289 kHz |
| Switch die area | 62 mm² | 30 mm² | 23 mm² |
| Semiconductor loss | 10.7 W | 23.2 W | 30.5 W |
| Switch / inductor / capacitor volume | 101 / 145 / 200 cm³ | 48 / 49 / 47 cm³ | 37 / 37 / 36 cm³ |
Design A uses large dies at low frequency, so it has the lowest loss but the largest inductor and capacitor. Design C switches nearly five times faster with smaller dies, shrinking the inductor and capacitor to between a quarter and a fifth of A’s size at almost three times the semiconductor loss. Design B, at the knee of the front, keeps most of C’s size reduction for a smaller loss penalty.
These are model results for comparing designs, not measured performance. The models simplify the thermal path and leave out the heat sink, which would penalise the high-loss designs further.
Implementation and Continuation
Parts of the framework have been implemented. The SiC device-modelling project demonstrates the semiconductor branch, connecting ANN loss models to converter loss calculations, and the optimisation code above trains a neural-network surrogate on its Pareto designs for fast evaluation.
The complete architecture remains a proposed framework. Subsequent AIPE work builds on it, connecting component calculations to optimisation and neural-network surrogate modelling within a wider design workflow.