
10 kW LLC Resonant Converter
This study examined an isolated 10 kW LLC resonant converter for a data-centre power application, from resonant-tank design by first-harmonic analysis to closed-loop simulation. The work remained at the simulation stage; no hardware prototype was built or tested.
How an LLC Converter Regulates Its Output
An LLC converter places a resonant tank between a switching bridge and an isolating transformer. The tank is formed by a resonant capacitor Cr, a resonant inductor Lr and the transformer’s magnetising inductance Lm. The voltage gain of the tank depends on the switching frequency, so the controller regulates the output by varying frequency as the input voltage and load change. Around the series resonant frequency, the transformer turns ratio sets the voltage conversion, and operating near resonance allows soft switching, which keeps losses low at high frequency.
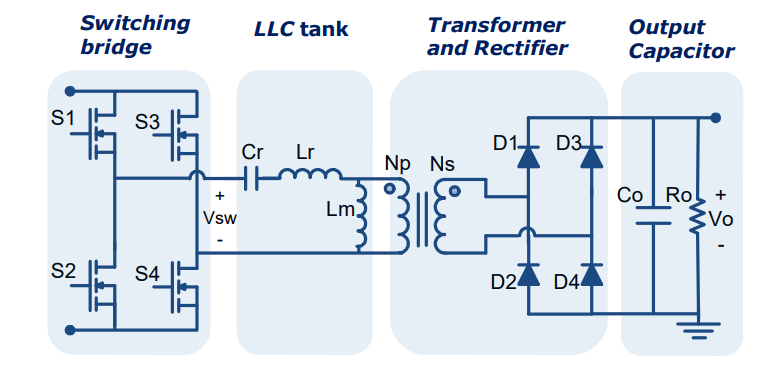
Specification and Design Method
The converter must supply a regulated 50 V output from a 750 V input that varies by ±10%:
| Design target | Value |
|---|---|
| Input voltage | 750 V nominal; 675–825 V range |
| Output voltage | 50 V |
| Maximum output power | 10 kW |
| Target operating frequency | 200 kHz |
The tank was designed by first-harmonic approximation: the square-wave bridge voltage is replaced by its fundamental, and the rectifier and load by an equivalent AC resistance Rac, which turns the converter into a linear resonant circuit.
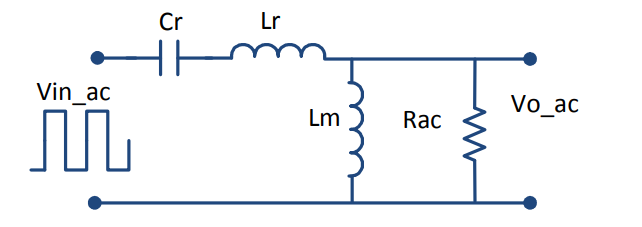
With the series resonant frequency fr, the quality factor Q and the inductance ratio m,
the tank’s voltage gain at normalised frequency Fx = fs/fr is
With a 15 : 1 transformer, the nominal 750 V input needs a gain of 1, and the 675–825 V range needs a gain from 0.909 to 1.111. The tank’s peak gain Kmax must therefore exceed 1.111 at full load.
Choosing Q and m
Q was swept at m = 10, then m at Q = 0.4. A low Q gives a high, sharp gain peak but makes the gain very sensitive to frequency; a high Q flattens the peak below the required gain. Reducing m, a smaller magnetising inductance, raises the peak gain at the cost of more circulating magnetising current.
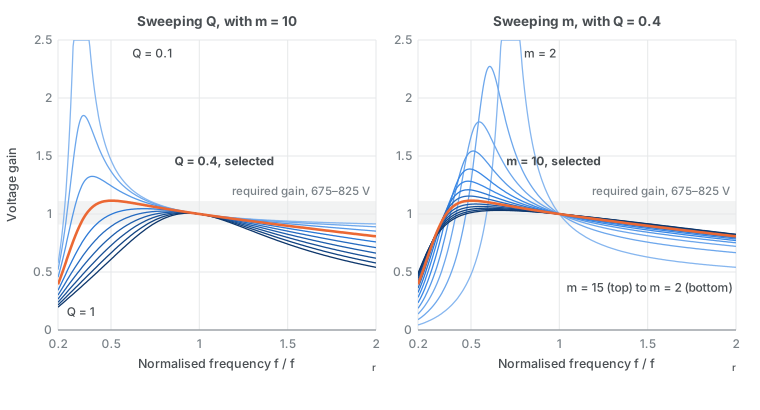
The selected Q = 0.4 and m = 10 give a peak gain of 1.115 at Fx = 0.504, just above the required 1.111, with these tank values:
| Parameter | Value |
|---|---|
| Resonant inductance Lr | 14.51 µH |
| Resonant capacitance Cr | 43.6 nF |
| Magnetising inductance Lm | 130.62 µH |
| Transformer turns ratio | 15 : 1 |
| Minimum switching frequency | 100.8 kHz |
Because the margin is small, lower m and a lower resonant frequency were also examined:
| Variant | Peak gain | Minimum frequency | Tank values |
|---|---|---|---|
| Q = 0.4, m = 9 | 1.155 | 97.9 kHz | Lm = 116.1 µH; Lr, Cr and turns ratio unchanged |
| Q = 0.4, m = 8 | 1.209 | 96.5 kHz | Lm = 101.6 µH; Lr, Cr and turns ratio unchanged |
| fr = 100 kHz, Q = 0.9, m = 10 | 1.009 | 92.5 kHz | Lr = 18.55 µH, Cr = 136.5 nF, Lm = 167.0 µH, turns ratio 8.0 : 1 |
Lowering m to 9 or 8 adds gain margin with the same resonant components. The 100 kHz variant roughly halves the turns ratio, so the tank only needs a gain of about 0.5, well below its peak of 1.009, which leaves ample margin even with a flatter, higher-Q tank.
Closed-Loop Simulation
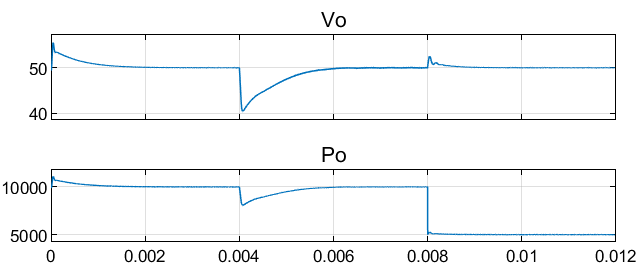
A PI controller regulates the output voltage by adjusting the switching frequency. In simulation, the input steps from 825 V to 675 V and the load then falls from 10 kW to 5 kW. After the input step, the output voltage dips and returns towards 50 V; the load reduction produces a smaller transient.
The switching waveforms show the operating principle: complementary gate signals for the two bridge diagonals, a MOSFET drain–source voltage, the sinusoidal resonant current with the triangular magnetising current, and the alternating rectifier diode currents.
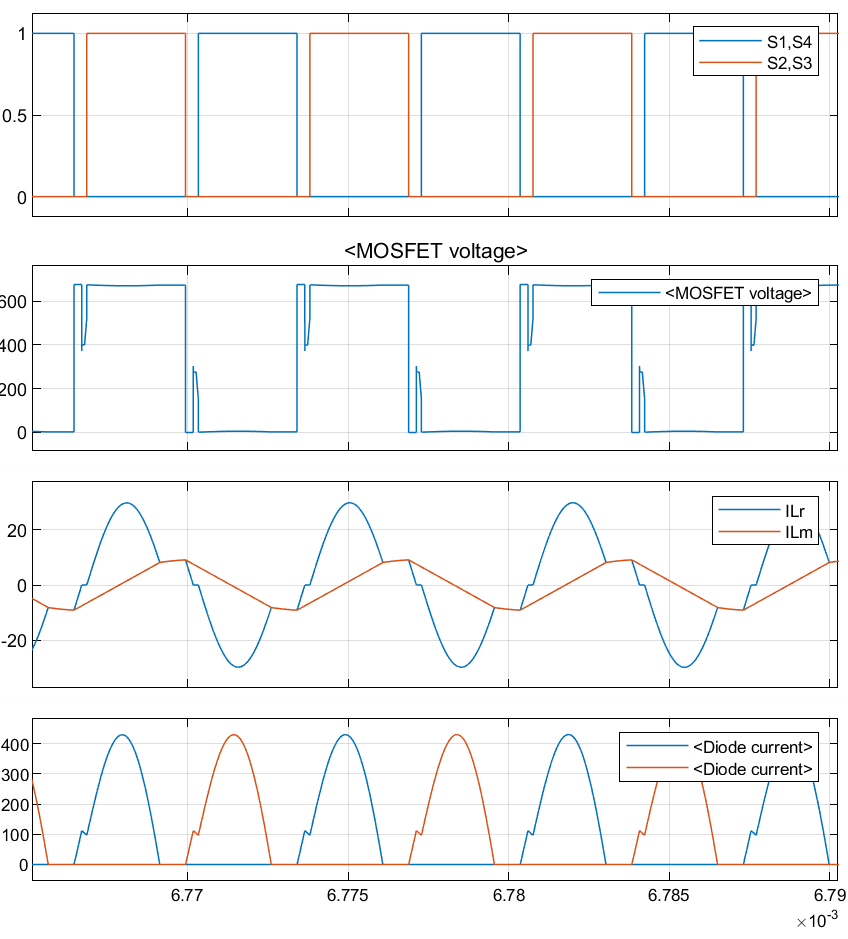
The simulation confirmed that the operating margin is tight at the low-frequency end of the range, where the tank must provide its highest gain, which motivated the lower-m and lower-frequency variants. Switching performance, losses, thermal behaviour and manufacturability would need further design and experimental verification.
Isolated Converters · Converter Design Optimisation · Back to Research